Whatcom County Housing Market Comparison: September 2026

Blaine & Birch Bay Real Estate Market Update: September 2026
October 3, 2026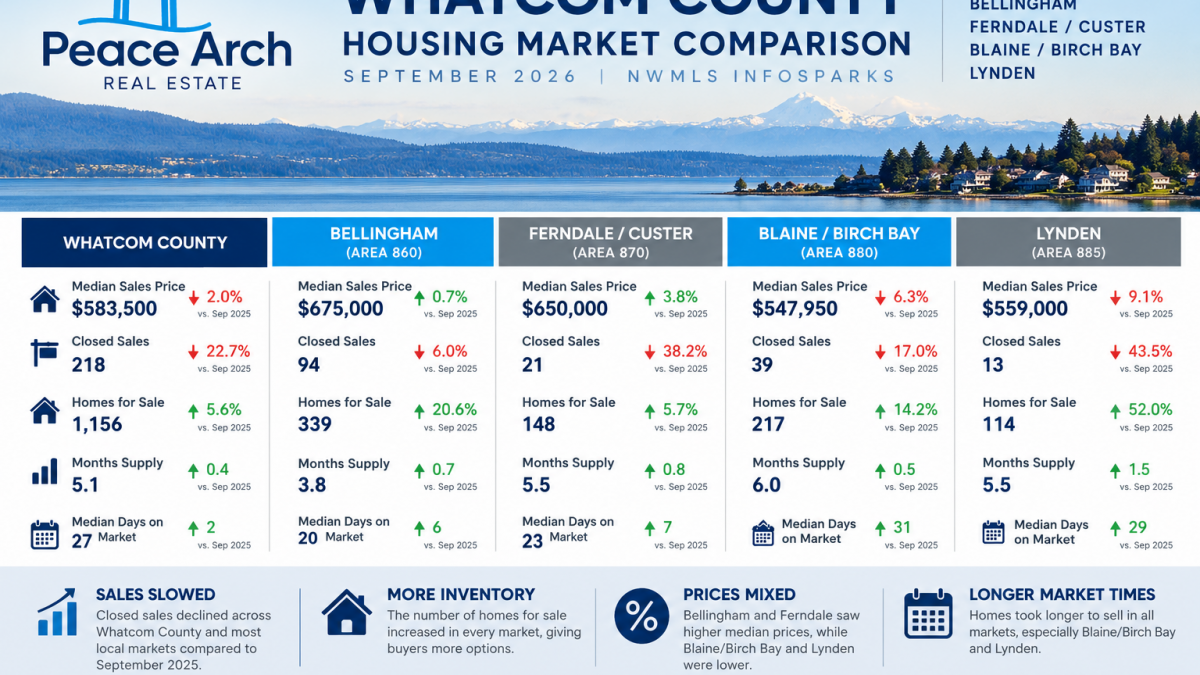
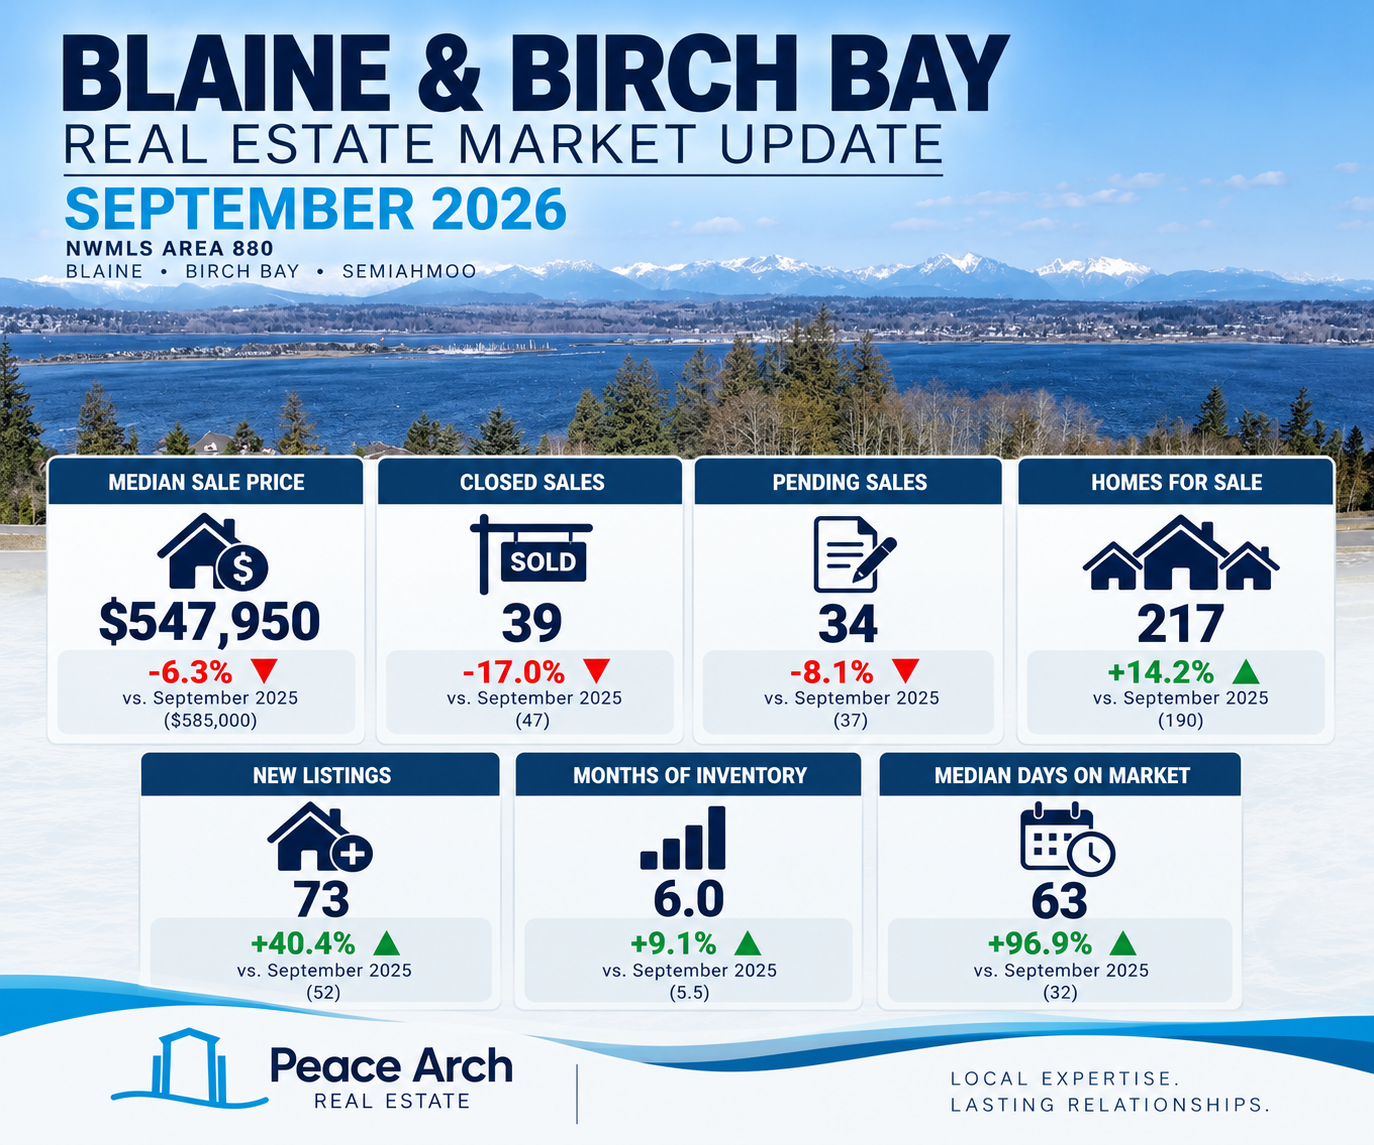
September brought a noticeable slowdown in housing activity across Whatcom County. Closed sales declined from a year ago in the county overall and in each of the four major local markets we track, while the number of homes available for sale increased.
The changes were not uniform, however. Bellingham continued to show comparatively strong demand, while Ferndale/Custer, Blaine/Birch Bay and Lynden experienced substantially slower sales activity.
September 2026 Market Comparison
| Market | Median Price | Closed Sales | Homes for Sale | Months Supply | Median DOM |
|---|---|---|---|---|---|
| Whatcom County | $583,500 (-2.0%) | 218 (-22.7%) | 1,156 (+5.6%) | 5.1 | 27 |
| Bellingham | $675,000 (+0.7%) | 94 (-6.0%) | 339 (+20.6%) | 3.8 | 20 |
| Ferndale/Custer | $650,000 (+3.8%) | 21 (-38.2%) | 148 (+5.7%) | 5.5 | 23 |
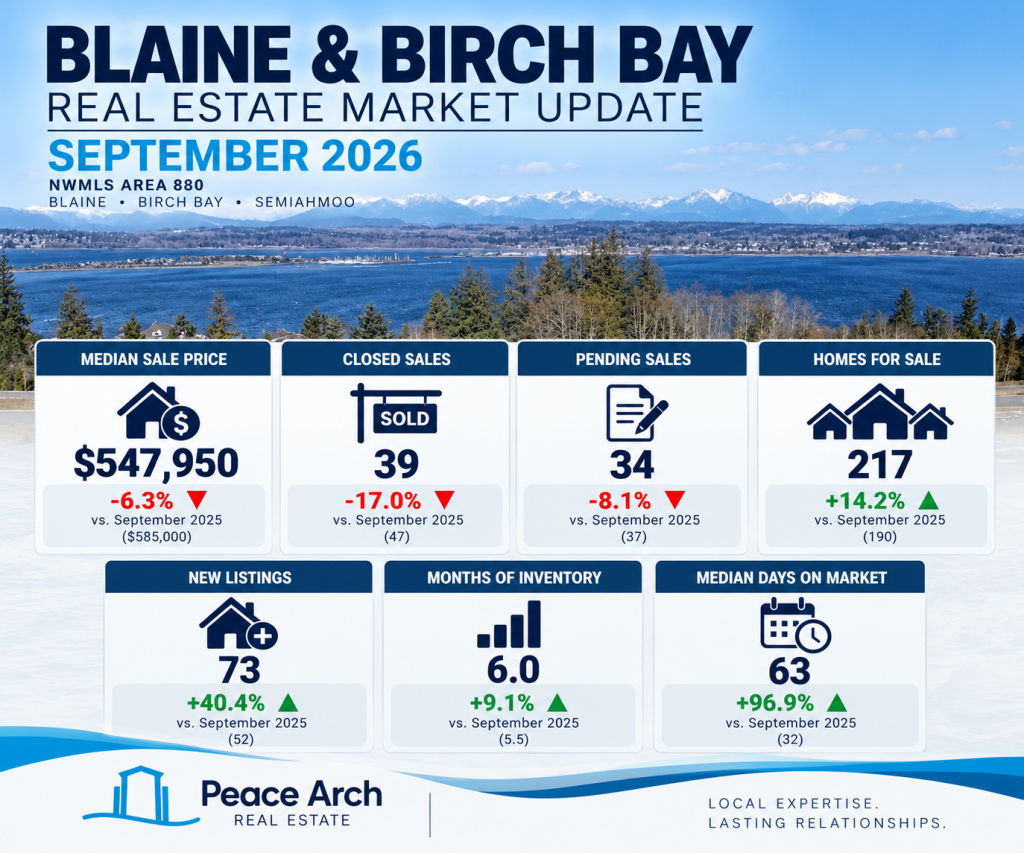
| Blaine/Birch Bay | $547,950 (-6.3%) | 39 (-17.0%) | 217 (+14.2%) | 6.0 | 63 |
| Lynden | $559,000 (-9.1%) | 13 (-43.5%) | 114 (+52.0%) | 5.5 | 60 |
September 2026 compared with September 2025. Residential and condominium properties. Source: NWMLS InfoSparks.
Sales Slowed Across Whatcom County
Countywide, 218 homes closed in September, down 22.7% from a year earlier. The slowdown was widespread, although its magnitude varied considerably.
Bellingham held up best, with 94 closed sales, down only 6%. Blaine/Birch Bay declined 17%, while Ferndale/Custer and Lynden recorded much larger monthly declines of 38.2% and 43.5%, respectively.
One month should not be mistaken for a longer-term trend, particularly in smaller markets where relatively few sales can produce large percentage changes. Rolling 12-month sales provide some useful perspective. Bellingham recorded 1,047 sales during the latest 12 months, up from 1,011 a year earlier. Blaine/Birch Bay and Lynden were also slightly higher on a rolling annual basis.
Ferndale/Custer was the exception. Its rolling 12-month sales declined from 371 a year ago to 328 today.
Buyers Have More Choices
Inventory increased in every market we track.
Whatcom County had 1,156 homes for sale, up 5.6% from September 2025. Bellingham inventory increased 20.6%, Blaine/Birch Bay increased 14.2%, and Lynden recorded the largest increase at 52%.
More inventory does not necessarily mean that every local market has become a buyer’s market. Bellingham, for example, had only 3.8 months of supply and a median market time of 20 days.
Conditions were considerably different farther north. Blaine/Birch Bay reached 6.0 months of supply and a median of 63 days on market. Lynden’s median market time increased from 31 days last September to 60 days this September.
For buyers, that generally means more selection and less of the extreme time pressure that characterized the low-inventory market several years ago. For sellers, it means more competition for those buyers.
What Are Prices Actually Doing?
September’s median prices produced some large differences between communities.
Bellingham’s median increased 0.7% from a year ago, while Ferndale/Custer increased 3.8%. Blaine/Birch Bay declined 6.3%, and Lynden declined 9.1%.
Those monthly figures require context.
A median sale price measures the midpoint of the homes that happened to sell during a particular period. It does not measure the change in value of an individual home, and relatively small local markets can experience significant monthly fluctuations based on the mix of properties sold.
Rolling 12-month medians paint a much more stable picture. Compared with one year ago, the rolling median is up approximately 1.3% countywide, 0.4% in Bellingham and 1.6% in Ferndale/Custer. Blaine/Birch Bay and Lynden are each essentially unchanged.
So far, the broader data show much more change in market activity than in home prices.
Bellingham Remains the Strongest of the Major Local Markets
Among the communities in this comparison, Bellingham continues to show the strongest combination of sales activity and market speed.
Its median sale price was slightly higher than last September, sales declined only modestly, and homes sold in a median of 20 days despite a 20.6% increase in inventory.
That contrasts sharply with Blaine/Birch Bay and Lynden, where median market times reached 63 and 60 days.
Ferndale/Custer presents a different picture. Its September median price increased, but closed sales declined substantially and its rolling 12-month sales volume is also lower than a year ago.
The Bigger Picture
Whatcom County continues to show an unusual combination: home prices remain near historic highs while transaction volume remains well below the levels of several years ago.
The county’s rolling 12-month median sale price is approximately $608,000, compared with $600,000 a year ago. At the same time, there were 2,717 closed sales during the most recent 12 months, compared with 3,931 during the 12 months ending September 2021.
So far, much of the housing market’s adjustment to higher borrowing costs and affordability constraints has occurred through fewer transactions rather than substantially lower prices.
September adds another month of evidence that buyers generally have more choices and sellers face more competition. Whether the sharp decline in September sales represents the beginning of another slowdown or simply a weak month will become clearer as we move through the fall.
Peace Arch Real Estate
Local expertise. Lasting relationships.